Impact of Social and Security Factors on the Intensity of Integration of Immigrants to the EU
(Volume 22, No. 3, 2021.)
Authors: Zoran Milosavljević PhD, Institute for Political Studies, Belgrade, Serbia; Andrijana Maksimović, PhD, State University, Novi Pazar, Serbia
DOI: https://doi.org/10.37458/nstf.22.3.1
Review paper
Received: October 1, 2021
Accepted: November 30, 2021
Abstract: The subject of the paper seeks to investigate the influence of social factors on the intensity of immigration of immigrants to the EU. Among the social factors that significantly influence immigration policies in the European Union, the authors singled out the following: demography, identity-culture, economy, socio-political and security factors. The main goal is to see how these social factors affect the intensity of immigration. The authors opt for MIPEX as an instrument for measuring immigration policy, which expresses political tendencies towards the integration of migrants. Based on the findings from the regression analysis, which determined the regression factor of the participation of indicators in correlation with MIPEX, the authors concluded that all indicators have a positive correlation, which indicates that the indicators were chosen correctly. In addition, the degree of regression factor is higher than 5%, which indicates a significant correlation.
Keywords: social factors, integration, immigrants, MIPEX, European Union, regression factor
INTRODUCTION

Immigration policies, in the widest sense of the word, constitute institutionalized forms of devised policies, and are, as such, of great and inestimable significance for scientific disciplines in the field of political sciences. Immigration policy is understood to mean “any state policy concerned with the transit of persons across country borders and in particular of those intending to reside and work in the host country”. Immigration policies involve “the combined frameworks of legal norms, laws and regulations, policies and traditions as well as organizational structures (subnational, national, regional and international) and the relevant processes that shape and regulate States’ approaches with regard to migration in all its forms, addressing rights and responsibilities and promoting international cooperation.”
An overview of immigration policies in the European Union demonstrates their variety in respect of the intensity of migratory transit and the treatment accorded to migrants. Social factors involve a multitude of causes which determine the migrants’ issue, public opinion and the immigration policies of immigration communities. A survey is undertaken of “raw”, unprocessed data on the basic reasons and motives for the movement of migrant masses, and the directions of their movement, their displacement routes, transit destinations and ultimate routes are identified. The principally applied method is the generic or historical approach. This method thoroughly monitors migrations as a physical and social phenomenon. It seeks to reveal the causes of the immigrants’ influx, the processes of their accommodation and employment as well as their attempts at societal and social integration into their new communities.
The empirical part of the survey focuses on a quantitative approach in the statistical and sociometric domains. Of all available quantifiers we opted for MIPEX or the Migrant Integration Policy Index. MIPEX is a tool or an instrument for measuring immigration policy which reflects political attitudes vis-à-vis the integration of migrants. Twenty-eight EU member states were singled out according to MIPEX scores (countries with a higher MIPEX are more inclined to integrating migrants into their societies). The higher a country’s MIPEX, the stronger its tendency to politically integrate migrants. And conversely, the lower a State’s MIPEX, the weaker its integrative capacity.
DEMOGRAPHIC FACTORS
Demographic population trends, its growth or a perceptible decline, play an important role in sustaining the public services system in a society (Knox, 2015, p. 42). A shortage of manpower will primarily be reflected on the quality of services that the citizens of a country will be provided in health care, prevention and treatment. As well, understaffing in education, social welfare, law enforcement (the police) and the judiciary, can render these systems non-functional and chaotic, resulting in a constricted range of services and poor levels of care/well-being for the citizens.
A demographic population decline will be directly reflected on the demand for manpower. Some EU member states are faced with major problems trying to compensate for the shortages in their workforce and fill the vacant positions of jobs which are direly needed. The manpower shortage results in a growing demand for workers, especially those with specialized professional training, with their wage rates being very high. Therefore we took the share in demand for highly skilled labor as the relevant demographic indicator, as we proceeded from the assumption that surplus human resources would largely affect the migrants integration policy index (MIPEX).
The share in demand for (highly) skilled workers by EU member states for the last measured year, 2018, shows the following results:
Table 1: 2018 Share in demand for highly skilled labor
|
EU Member
States (25 of 28 countries)
|
Share in demand
for
highly skilled labor
|
|
Finland
|
95%
|
|
Netherlands
|
79%
|
|
Sweden
|
74%
|
|
Luxembourg
|
73%
|
|
Germany
|
68%
|
|
Belgium
|
67%
|
|
France
|
66%
|
|
Italy
|
63%
|
|
Denmark
|
62%
|
|
Estonia
|
60%
|
|
Ireland
|
59%
|
|
Austria
|
58%
|
|
Lithuania
|
57%
|
|
Spain
|
55%
|
|
Latvia
|
54%
|
|
Portugal
|
53%
|
|
United
Kingdom
|
48%
|
|
Slovenia
|
45%
|
|
Greece
|
43%
|
|
Bulgaria
|
42%
|
|
Czech Republic
|
41%
|
|
Poland
|
38%
|
|
Slovakia
|
37%
|
|
Romania
|
35%
|
|
Hungary
|
29%
|
|
Malta
|
–
|
|
Cyprus
|
–
|
|
Croatia
|
–
|
A particular problem lies in the socio-biological phenomenon of “aging nations”, which is the most pronounced in Western European countries, the so-called „old EU Member States“. Consequent to such an aging trend the working age population is decreasing (Schoenmaeckers & Kotowska, 2005, p.127).
CULTURAL IDENTITY FACTORS
Today the immigration issue frequently involves debates on adverse population policy trends in society, namely pointing out the dangers to a nation’s national and cultural identity. The negative connotation is often associated with the clash between the cultural matrices of the “natives” and the “newcomers” in the same space (Goodman, 2013, p.1). The migrant crisis has demonstrated most painfully that no one is immune to geopolitical developments worldwide, with EU citizens having been taken aback by the way global developments could affect their everyday lives. This has led to a reassessment of the very roots of the EU, with conspicuously growing differences between European countries which adopted different positions in respect to this problem and acted in pursuit of their own decisions and interests. These interests varied, ranging from absolutely rejecting the entry of migrants into their territories and erecting walls, to according them welcome (Stojadinović and Manić, 2017, p.155).
Immigration changes can be so forceful and formidable as to significantly change the statistical picture of society in favor of the “newcomers”, whose birth rate is usually so much higher that it can be quantified as “several times over”. As a consequence, this instills a widespread sense of jeopardy in the resident population, the so-called “fear from otherness” and produces collective frustration, and even hysteria, in particular in communities which have traditionally been more or less ethnically homogeneous. In such societies there is a growing awareness of the dangers of an invasion of foreigners, not only of threats to the domestic culture and civilization, but also of possible alterations of the biological fabric of the nation and its ethnic structure (Anspaha, 2008, p.5). This gives rise to a xenophobic climate in which the immigrant population is seen as threatening to “import” a different culture and identity, and even civilization (Anspaha, 2008, p.4).
The majority of immigrants exhibit no effort to fully adapt to the new conditions of life and work, nor do they exhibit any tendencies towards acculturation in order to fully integrate into the new environment by accepting the basic value matrices of the new culture (Rudiger & Spencer, 2004, p.4). Namely, immigrants come to the EU countries mainly in order to solve their burning vital problems and satisfy their basic needs, and thus secure a minimum of living conditions for themselves and their families which they are unable to obtain in their home countries of origin. That is why immigrants quickly find jobs available to them at the market but fail to exhibit any intention of involvement in the broader integrative processes of their new communities. They simply cannot find the time for such activities and neglect the social and cultural aspects of the communities they have come to.
The cultural identity homogeneity/heterogeneity of European Union member states cross-referenced with immigration tradition is as follows:
Table 2: Cultural identity homogeneity with/without immigrant tradition
|
|
Long-established
immigration
|
Recent immigration
|
Little and no immigration
|
|
Internal or civic-national
homogeneity
|
Germany, Austria Denmark ,France Luxembourg, Netherlands (Group
1)
|
Greece, Italy
Portugal, Ireland Czech Republic (Group 4)
|
|
|
Nationally heterogeneous
(multiethnic) without minorities
|
Belgium
Malta
United Kingdom
(Group 2)
|
Spain (Group
6)
|
|
|
Nationally heterogeneous and
ethnically homogeneous with Traditional Minorities
|
Estonia
Latvia
Lithuania
Sweden
Finland (Group
3)
|
|
Bulgaria,
Croatia Cyprus, Hungary Poland, Romania Slovakia, Slovenia (Group 5)
|
Regression analysis of national homogeneity and the length of immigration in relation to MIPEX resulted in equation y=60-2.5X with R2 of 0.068, meaning that homogeneity and the length of immigration contribute 6.8% to a change of MIPEX, observing all the groups collectively.
Nonparametric analysis of the correlation between homogeneity and the length of immigration, as one variable, and of MIPEX, resulted in the groups shown in the graph below:
Graph 1: Immigration groups relative to MIPEX
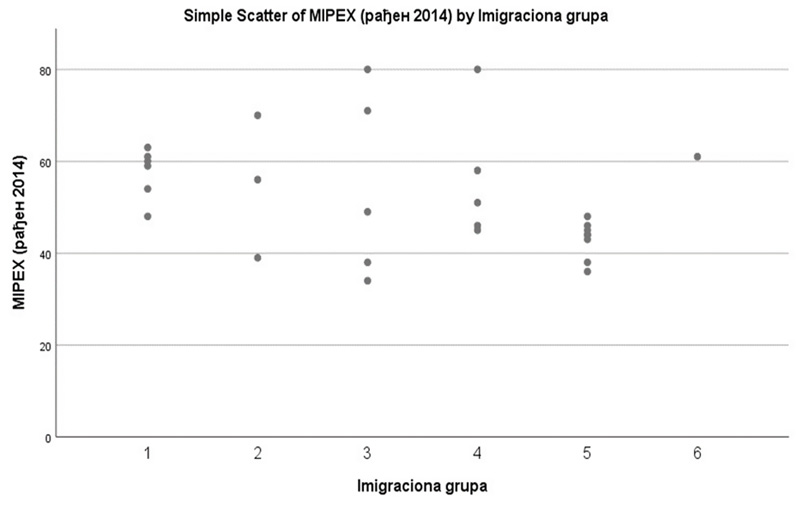
The graph shows that two groups of European Union member states clearly stand out: group 1 and group 5, significantly grouped around MIPEX:
- Group 1 from 50 to 65 (21%)
- Group 5 from 35 to 48 (28.6%)
In other words, this means that groups of countries with similar characteristics are grouped around similar MIPEX values.
Such grouping is also confirmed by the findings of the statistically significant Spearman analysis which point to a clear correlation of – 0.41. (In point of fact, the correlation sign is irrelevant, as arbitrary codes have been used to mark groups of countries with arbitrary codes with a statistical significance of p<0.03).
On the other hand, regression analysis of linked ”borderline value groups”, Group 1 and Group 5, results in equation: y=61-3.6x
Graph 2: Regression line of Groups 1 and 5 and MIPEX
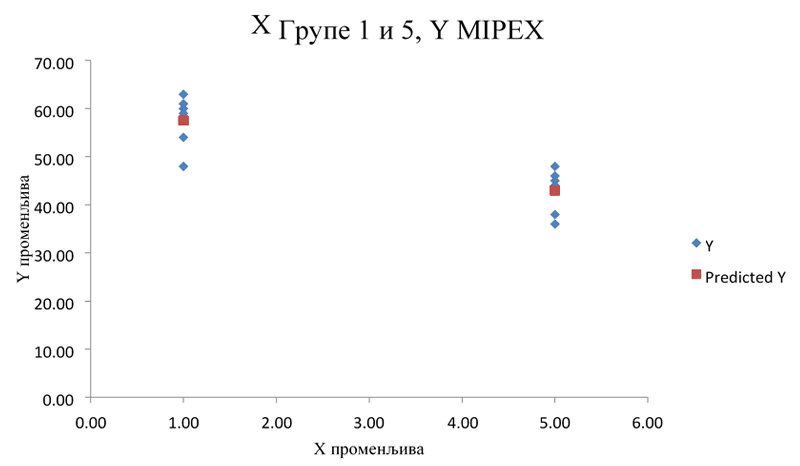
The regression line demonstrates a manifest grouping of countries in Group 1 (Germany, Austria, Denmark, France, Luxembourg, The Netherlands) and Group 5 (Bulgaria, Croatia, Cyprus, Hungary, Poland, Romania, Slovakia, Slovenia) relative to the value of MIPEX.
The regression factor presents a coefficient of: R2= 0.73, meaning that, taken in conjunction, the individual Groups 1 and 5 have a deterministic effect on MIPEX values. As much as 73% of MIPEX can be accounted for by these two groups of countries (Group 1 and Group 5).
(Individually observed the share of Group 1 in MIPEX is between 45% and 65%, and that of Group 5 between 25% and 45%).
ECONOMIC FACTORS
Economic factors evidently underlie the basic immigration motives as the principal drivers of immigration, as well as the immigration-related political responses aiming to create a milieu for the successful integration of migrants into their new communities. The massive influx of refugees and/or migrants over a very short period of time can greatly disrupt the balance between the supply and demand of labor, which is consequently sometimes denoted as “labor market flooding”. Thus migrations become not only a geopolitical but also a geo-economics phenomenon. The closed door policy trend in evidence in Western European and North American countries, given the connected vessels economy, has a profound influence on the migrant issue, affecting not only the ultimate destination countries but also adjacent, less stable transit societies, which experience the migrant crisis only indirectly (Quille, 2010).
The effects of migratory movements can be both positive and negative. The positive effects include: relieving high unemployment pressures in the sending countries, defusing social tensions and increasing revenue on the basis of remittances. The most important adverse effects of the economic factors of migrations include: depopulation of emigration countries, potential labor shortages, need to import labor from third world countries, business stagnation and economic decline.
A salient consideration among the economic factors of immigration policies concerns the “brain drain” of predominantly young and highly educated professionals from underdeveloped countries to highly developed societies. A clear strategy is pursued within the EU to include young scholars and researchers in postgraduate/PhD studies as well as in projects leading to the integration of the less developed members and of candidate countries from Eastern and South-Eastern Europe (Favell, 2008, p.701-716).
The gross domestic product (GDP) per capita was chosen as the economic indicator. Expressed in index points for 2018 it is as follows:
Table 3: GDP per capita for 2018
|
EU
member state
|
GDP per capita
for 2018 in index points
|
|
Luxembourg
|
254
|
|
Ireland
|
187
|
|
Netherlands
|
129
|
|
Austria
|
127
|
|
Denmark
|
126
|
|
Germany
|
123
|
|
Sweden
|
121
|
|
Belgium
|
115
|
|
Finland
|
110
|
|
France
|
104
|
|
United Kingdom
|
104
|
|
Malta
|
98
|
|
Italy
|
95
|
|
Spain
|
91
|
|
Czech Republic
|
90
|
|
Cyprus
|
87
|
|
Slovenia
|
87
|
|
Estonia
|
81
|
|
Lithuania
|
81
|
|
Slovakia
|
78
|
|
Portugal
|
76
|
|
Poland
|
71
|
|
Latvia
|
70
|
|
Hungary
|
70
|
|
Greece
|
68
|
|
Romania
|
64
|
|
Croatia
|
63
|
|
Bulgaria
|
50
|
The regression line showing the correlation between MIPEX and the GDP, which reflects the country’s economic strength, is given below:
Graph 3: GDP per capita and MIPEX
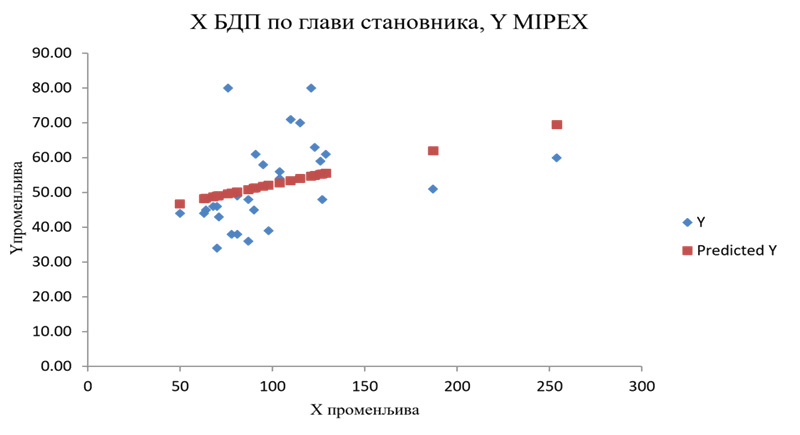
Regression analysis results in equation y=41.18+0.11x. It indicates a positive correlation – the curve slope is not marked, being 0.11.
On the other hand, parameter R2=0.13 indicates that 13% of the MIPEX value depends on the change of the per capita GDP in 2018, and that this index significantly impacts the MIPEX level. It follows that there exists a clear and visible correlation between the level of the GDP per capita and the proclivity to integrate migrants, which also associates the GDP with immigration policies.
SOCIOPOLITICAL FACTORS
Stable political and legal institutions make it possible for the system to operate even when the number of immigrants is not negligible. In such a case, the political system and its strong and well-oiled institutions aim to functionalize relations in society, securing peace and stability of the system, empowering migrants to successfully set up home, adapt, accept working roles in the “new society”, eventually get socialized, go through the process of acculturation and ultimately integrate into the new community as its equal citizens.
Constituting an important aspect of immigration policy is the question of the integration of immigrants into the resident societies of Western Europe they have come to. The value benchmarks which arise from the disparate cultural anticipations of the immigrants and the domestic population, can engender social discord, misunderstanding, intolerance and even social conflict in multiracial and multiethnic communities (Dancygier, 2010,p. 22).
Great differences in the way of life, opposed cultural and religious views, different worldviews and similar, have social and cultural segregation as a consequence (Koopmans, 2014). A special danger is posed by social gaps and discrimination between the newcomers and the native, resident population where the latter fully exercise their rights and benefit from the efficient operation of all protection/welfare mechanisms.
This has given rise to frequent recent attempts at institutionalizing the representation of migrants and asylum seekers at the institutions of the systems of member states having migrants. It is quite widely held that in such political and social circumstances immigrants would be able to exercise their rights solely through their own political representation. Thus, in some western EU member states, so-called “immigrants’ minority parties” have recently been set up which seek to articulate the basic interests of immigrant communities before the political institutions of the receiving countries (Martiniello, 2005).
In political terms, only a thin social stratum of immigrants, for the most part highly educated, express the willingness to fully adapt to the new milieu, to undergo the process of acculturation and to integrate into the new common society. However, a significantly wider stratum of the immigrant population treats the new community in which they have settled in an eminently utilitarian fashion.
Some maintain that the migrant crisis is not so much ascribable to the flood of refugees itself, who have already by now been successfully absorbed by the most developed EU labor markets, but that the problem fundamentally lies in the deep rifts within the Union regarding the adoption and implementation of a common immigration policy (Martiniello, 2006).
The growing poverty and unemployment throughout Europe heighten the pressure on states to respond to these social risks. Providing social entitlements amid an atmosphere of the mentioned social risks has significantly raised the share of social security allocations in the GDP, with the practice of restructuring social entitlements depending on the social model existing in individual countries (Babić, 2018, p.64).
For social policy indicators we selected budgetary allocations for welfare in each one of the 28 European Union member states, expressed in 2018 for the last measured year, 2017. This indicator was as follows:
Table 4: Budgetary allocations for welfare in 2017
|
EU member state
|
Budgetary allocations for
welfare in 2017
|
|
Finland
|
24.5
|
|
France
|
24
|
|
Denmark
|
23
|
|
Italy
|
21
|
|
Austria
|
20.5
|
|
Sweden
|
20
|
|
Belgium
|
19.5
|
|
Greece
|
19.5
|
|
Germany
|
19.5
|
|
Luxembourg
|
19
|
|
Portugal
|
17
|
|
Slovenia
|
16.5
|
|
Netherlands
|
16
|
|
Poland
|
16
|
|
Spain
|
16
|
|
United Kingdom
|
15
|
|
Slovakia
|
14.5
|
|
Hungary
|
14.5
|
|
Croatia
|
14.5
|
|
Estonia
|
13
|
|
Cyprus
|
13
|
|
Bulgaria
|
12
|
|
Czech Republic
|
11.5
|
|
Lithuania
|
11
|
|
Latvia
|
11
|
|
Malta
|
11
|
|
Romania
|
11
|
|
Ireland
|
9.5
|
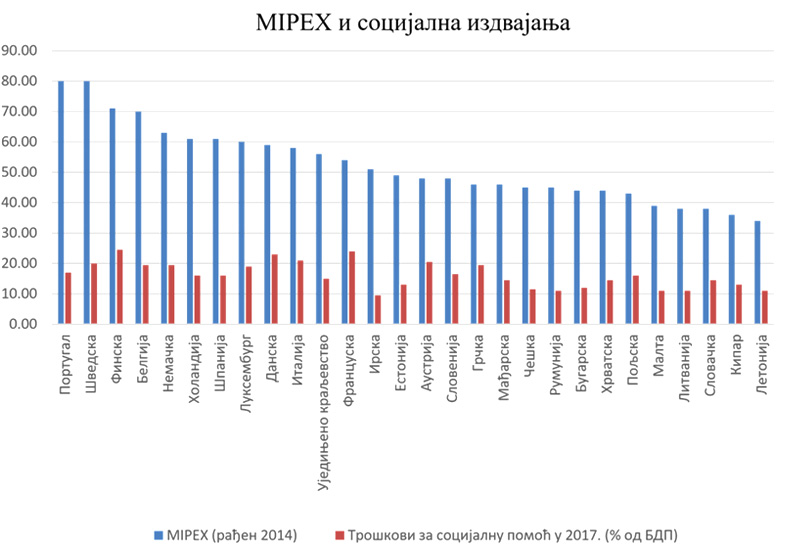
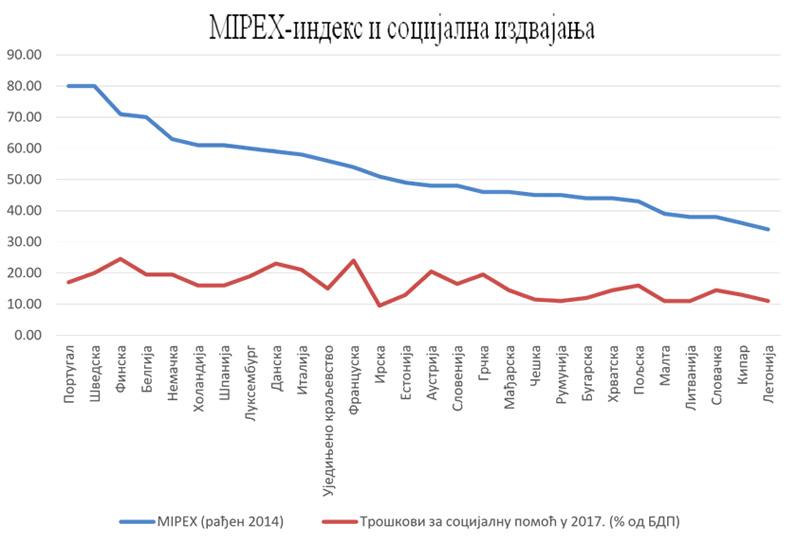
A graph showing the relationship between MIPEX and social welfare costs expressed as a % of the total sum of allocations from the gross domestic product is given below:
Graph 4: Welfare benefits and MIPEX
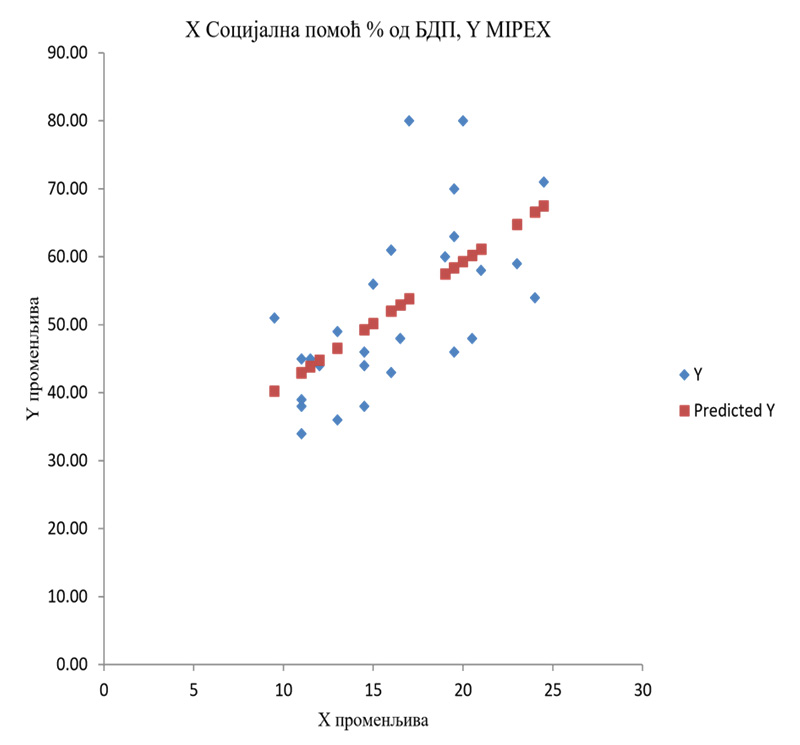
The regression findings result in a regression line equation of a shape expressible as the following mathematical formula: y=22.92+1.82x. Here R2=0.38, indicating a 38% change in MIPEX which is directly related to changes in social welfare allocation costs. The finding indicates a steep curve slope of 1.82, for each unit of welfare change, with MIPEX changing by 1.82 points.
Graph 5: MIPEX and social welfare
SECURITY FACTORS
The porous borders of EU member states, the sense of insecurity and the fear of the resident population from individual attacks and violence or terrorist attacks on facilities or civilians, have given the security factor a prominent role within the migrants’ issue. The swelling influx into Europe of migrants from the Asian and African continents has prompted debates and raised the issue of their integration in the new milieux and of their susceptibility to radicalization. The inflow of migrants is perceived as a potential threat to the security of the citizens of European countries, with such a perception doubtlessly potentially further hindering their integration (Đurđević and Vuković, 2016, p.218).
The Global Terrorism Index (GTI) is yet another indicator that can demonstrate the relation with immigration policies on a scale expressed through MIPEX. Below is a table ranking European Union member states from the lowest to the highest GTI:
Table 5: Global Terrorism Index
|
EU member state
|
Global
Terrorism Index 2018
|
|
|
Portugal
|
|
0
|
|
Sweden
|
|
936
|
|
Finland
|
|
501
|
|
Belgium
|
|
60
|
|
Germany
|
|
601
|
|
Netherlands
|
|
960
|
|
Spain
|
|
24
|
|
Luxembourg
|
|
0
|
|
Denmark
|
|
817
|
|
Italy
|
|
736
|
|
United Kingdom
|
|
610
|
|
France
|
|
475
|
|
Ireland
|
|
45
|
|
Estonia
|
|
220
|
|
Austria
|
852
|
|
Slovenia
|
0
|
|
Greece
|
291
|
|
Hungary
|
291
|
|
Czech Republic
|
562
|
|
Romania
|
0
|
|
Bulgaria
|
315
|
|
Croatia
|
14
|
|
Poland
|
719
|
|
Malta
|
0
|
|
Lithuania
|
0
|
|
Slovakia
|
115
|
|
Cyprus
|
206
|
|
Latvia
|
0
|
A graph of the regression analysis of the correlation between MIPEX and the Global Terrorism Index (GTI) is given below:
Graph 6: Global Terrorism Index in 2018 and MIPEX
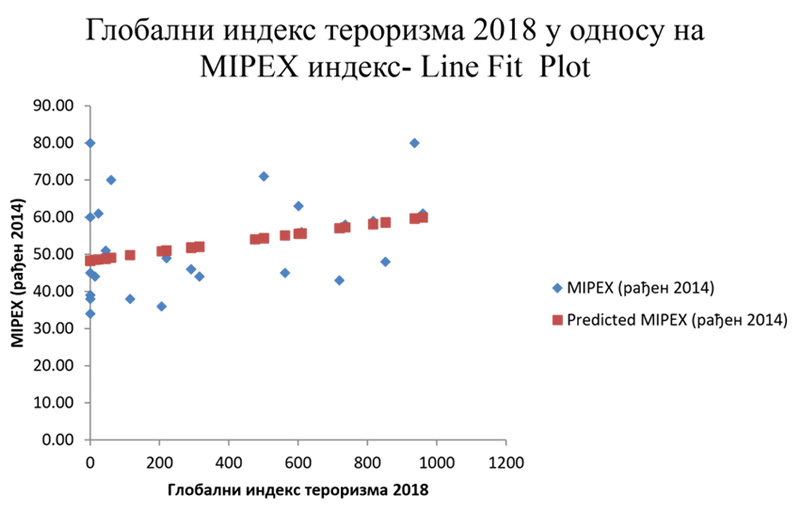
Regression analysis produced the following line equation: y= 48.3+0.01X. The expressed equation indicates a line having a relatively small upward slope of a 0.01volume. With R2=0.10 it is evident that 10% of MIPEX value changes can be related to changes in the Global Terrorism Index (GTI).
Transit migratory flows can also be perceived as complex mechanisms and systems of movement of persons who quickly adapt to the misfortune that has befallen them and are compelled to avail themselves of loopholes in the law and the supervision system. This particularly involves attacking the weaknesses and flaws in the unstable systems of “new European Union members” which are faced with formidable problems concerning their underdeveloped, weak and porous institutions, uncontrolled, corrupt, inefficient administration and similar issues (Givens & Luedtke, 2004, p.145-165). These countries are incapable of monitoring and controlling migratory processes. The constant tightening of European control measures compels an ever increasing number of migrants to rely on services provided by smuggling channels in order to overcome numerous obstacles. A fully self-organized transit movement of migrants is considered an exception, with the majority of migrants moving and entering Europe in irregular i.e. illegal ways, having become the rule.
The mechanisms and procedures for protecting the security of people and property from migrants in their new, temporary or final destination merit special attention. Many of these persons are treated as refugees or have the status of persons displaced by war, or are, simply, immigrants coming from potentially dangerous areas engulfed by war or civil conflicts, in which serious war or combat operations have been conducted.
A particular security problem lies in the widespread attempts at abusing the right to asylum, a political-legal facility granted on the basis of political persecution and dissidence. A one-time progressive legal concept is now subject to extensive abuse by immigrants whose motive for coming to the highly developed EU member states is not that they need political protection but subsistence (Messina, 2002). Among the particular security issues posed before immigration and transit countries is the question of the security of migrants and of their human rights. The European Commission has prepared numerous guidelines and programs dealing with mechanisms for the protection of migrants’ human rights during the process of relocation from their places of departure to their new communities.
CONCLUSION
The idea underlying this survey was to correlate a number of indicators in the areas of demography, cultural identity, economy, social policy and social security and to cross-reference them with MIPEX as a constant and invariable indicator. The latest 2018 data was used for the previous year, 2017. Based on the results of the regression analysis, which established the regression factor of the participation of indicators in correlation with MIPEX, the following conclusion can be drawn: The highest impact on MIPEX, as the measure of the intensity of the integration of migrants in their new milieu is that of the following indicators: cultural identity homogeneity/heterogeneity 73%, share in demand of (highly)skilled labor 39%, social welfare allocations (38%), Global Terrorism (danger of) Index 7%. As well, all the indicators are positively correlated, namely properly selected. A regressive factor degree above 5% is indicative of significant correlativity.
Citate:
APA 6th Edition
Milosavljević, Z. i Maksimović, A. (2021). Impact of social and security factors on the intensity of integration of immigrants to the EU. National security and the future, 22 (3), 101-123. https://doi.org/10.37458/nstf.22.3.1
MLA 8th Edition
Milosavljević, Zoran i Andrijana Maksimović. "Impact of social and security factors on the intensity of integration of immigrants to the EU." National security and the future, vol. 22, br. 3, 2021, str. 101-123. https://doi.org/10.37458/nstf.22.3.1. Citirano DD.MM.YYYY.
Chicago 17th Edition
Milosavljević, Zoran i Andrijana Maksimović. "Impact of social and security factors on the intensity of integration of immigrants to the EU." National security and the future 22, br. 3 (2021): 101-123. https://doi.org/10.37458/nstf.22.3.1
Harvard
Milosavljević, Z., i Maksimović, A. (2021). 'Impact of social and security factors on the intensity of integration of immigrants to the EU', National security and the future, 22(3), str. 101-123. https://doi.org/10.37458/nstf.22.3.1
Vancouver
Milosavljević Z, Maksimović A. Impact of social and security factors on the intensity of integration of immigrants to the EU. National security and the future [Internet]. 2021 [pristupljeno DD.MM.YYYY.];22(3):101-123. https://doi.org/10.37458/nstf.22.3.1
IEEE
Z. Milosavljević i A. Maksimović, "Impact of social and security factors on the intensity of integration of immigrants to the EU", National security and the future, vol.22, br. 3, str. 101-123, 2021. [Online]. https://doi.org/10.37458/nstf.22.3.1
REFERENCES:
1. Anspaha, K. (2008). The Integration of Islam in Europe – Preventing the radicalization of Muslim diasporas and counterterrorism policy. Fourth Pan-European Conference on EU Politics : University of Latvia, Riga.
2. Babić Mihajlović, S. (2018). Politike aktivacije u funkciji neoliberalizacije socijalnih prava u Evropi nakon ekonomske krize.Srpska politička misao, 59 (25), 59-73.
3. Dancygier, R. (2010). Immigration and Conflict in Europe. Cambridge University Press.
4. Đurđević, Z., Vuković,S. (2016). Migrantska kriza i teroristička pretnja. Srpska politička misao, 54(23), 217-232.
5. Favell, A. (2008).The new face of East-West migration in Europe. Journal of Ethnic and Migration Studies, 34 (5), 701-716.
6. Givens, T., Luedtke, A. (2004). The Politics of European Union Immigration Policy – Institutions, Salience, and Harmonization. The Policy Studies Journa,l 32 (1) , 145-165.
7. Goodman, W. S. (2013). Immigration and Conflict in Europe. The Journal of Politics, 74 (3).
8. Knox, P. (2015). The Geography of Western Europe – A Socio-Economic Study. Routledge.
9. Koopmans, R. (2005). Contested Citizenship – Immigration and Cultural Diversity in Europe. Minnesota Press.
10. Martiniello, M. (2005). Political Participation, Mobilisation and Representation of Immigrants and Their Offspring in Europe. Willy Brandt Series of Working Papers in International Migration and Ethnic Relations. N°1/05. School of International Migration and Ethnic Relations: Malmö University.
11. Martiniello, M. (2006). Towards a coherent approach to immigrant integration policy(ies) in the European Union. European Doctorate on Migration, Diversity and Identities. Université de Liège.
12. Messina, A. (2002). West European Immigration and Immigrant Policy in the New Century. Greenwood Publishing Group.
13. Quille, G. (2010). The European External Action Service and the Common Security and Defence Policy. EU Crisis Management – Institutions and Capabilities in the Making. Instituto Affari Internazionali : Roma.
14. Schoenmaeckers, R., Kotowska I. (2005). Population Ageing and Its Challenges to Social Policy – Study Prepared for the European Population Conference. Issue 50. Edition du Conseil de l’Europe : Strasbourg.
15. Stojadinović, M., Manić,M. (2017). Sirijska kriza-uzroci i posledice. Srpska politička misao, 56(24), 153-167.
16. Patrick, S. (2007). Ethnic statistics and data protection in the Council of Europe countries – Study Report. Institut National d'Etudes Démographiques: Strasbourg.
17. Rudiger, A., Spencer, S. (2003). Social Integration of Migrants and Ethnic Minorities – Policies to Combat Discrimination. The Economic and Social Apects of Migration. The European Commission and OECD : Brussels.
18. https://skillspanorama.cedefop.europa.eu/en/news/oecd-skills-jobs-database-2018
19. https://ec.europa.eu/eurostat/statisticsexplained/index.php/GDP_per_capita,_consumption_per_capitaandpricelevelindices
20. https://ec.europa.eu/eurostat/statisticsexplained/index.php/Government_expenditure_on_social_protection
21. http://visionofhumanity.org/app/uploads/2017/11/Global-Terrorism-Index-2017.pdf