Author: Assoc. Prof. Giliam de Valk, Leiden University, Netherland
DOI: https://doi.org/10.37458/nstf.23.1.1
Original scientific paper
Received: September 17, 2021
Accepted: January 10, 2022
Abstract
In Analytic Black Holes it is advocated to start a new, second, revolution in security and intelligence analysis. After the first revolution, which started in the Netherlands as late as 2006 with the massive training in Structured Analytic Techniques at both the academia and at the MoD (e.g. Defense Intelligence and Security Institute).
A new second revolution – that of Augmented Intelligence – is at hand as a result of two developments, the change in data flows and the need for new products. Data are exploding, especially unstructured data. But the majority of the data remains unused in analyses. Furthermore, hybrid threats and real time intelligence for the protection of the critical infrastructure demand a new approach towards analysis. This gap needs to be filled, among others, by data science cells that can process data automatically. This way, a new analytic approach can be reached – that of Augmented Intelligence – in which humans and machines are paired in the analytic process.
Human Analysis is likely to develop more towards to limit the number of data taken into account, but those data will have a high causal significance. Machine Analysis, on the other hand, will process huge amount of data and focus on correlations in the first place. Augmented Intelligence, will be a merger of both, that can manifest itself by different combinations of both. It will deal with data that now remain unused. It can fill the gap of the identified analytic black holes.
 Dealing with the analytic black holes will enhance the security, and make us more effective in protecting our critical infrastructure.
Keywords: Augmented Intelligence, intelligence analysis, Analytic Black Holes, Data, Data science, Rumsfeld Matrix
Introduction: a data-oriented perspective
This essay starts with a very basic question – what data is available? Normally, issues are addressed from the perspective of the problems to be solved. Answers are sought for specific problems, as early warning or policy planning, or it deals with problems in the sense of its complexity, such as puzzles, mysteries and wicked problems. Then, as a part of those problem oriented approaches, the issue of data overload is addressed.
In this essay, the perspective is turned the other way round. It is approached from the perspective of the data, instead of the problem. What data is available? And how could we use more data and to what additional insights would that lead to? The data perspective is taken, because we have issues that we could and should address, but that we now simply overlook because we do not think of them. Furthermore, in protecting the critical infrastructure we deal with the alpha (α) and the beta (β). The α is the chance that you incorrectly conclude that there is a significant relationship between phenomena. The β is the chance that you do not discover a weak, but actual existing, relationship between phenomena. The data that remains unused as a result of our nowadays approaches cannot contribute to reduce the values of these alpha and beta. In other words, we don’t address issues as accurate as possible, and we will miss threats and undesired developments. By not including this data, we do not contribute as optimal as possible to our security of the critical infrastructure as would have been possible. To make things more complicated, an estimated 80% of the data is unstructured, and the total amount of data is exponentially growing. In short, the data perspective points us at aspects that we may miss or overlook.
At first sight, the problem is not so clear because we process data already in different ways. Many of the data – at least in the Dutch context – are processed by humans. And even more data is processed by machines. A lot of the calculation and processing is done my machines. But this does not deal with the issue of all the data that is not used yet. We simply do not use the majority of the data that is available. Is it because we do not apply new analytic techniques? Is it because we do not make use of machines (computers) enough? Do we use these machines in a too limited way? Machines can do more than just to calculate and to process. New opportunities will arise if machines are used for other aspects than to calculate and to process: as for the research design or, after the data is processed, for the assessment.
As put, the starting point is not the problem, but the vast amount of data that remains unused. How could we incorporate this data if we look at the research process as a whole? Especially the start (the design) and the end (the assessment) of the analytic process are likely to be a leverage for rethinking. If this results in additional or new insights, the phases of calculation and processing – that are in between – will follow then in a natural way. Therefore, we primarily focus in this essay on the phase of the research design and the assessment. The issue of data leads to three questions:
1. What do we do and what do we not do with data, and how much data do we leave unused?
2. How could we fill the gap?
3. And to what extra capabilities could this new approach lead to?
As a context for these questions, the critical infrastructure is taken. Then, not only in an academic sense, but also in a practical sense we can identify possible gaps.
What do we do and what do we not do with data, and how much data do we leave unused?
In the next scheme, a quick overview, is presented of what we do and what we don’t do with data. It is composed of two axes. Firstly, there is the axis of the design of the research versus the assessment – the outcomes – of those analyses. Secondly, there is the axis of an analysis by machines or by humans. It results in the next scheme. After this scheme, some remarks will be made for each quadrant.
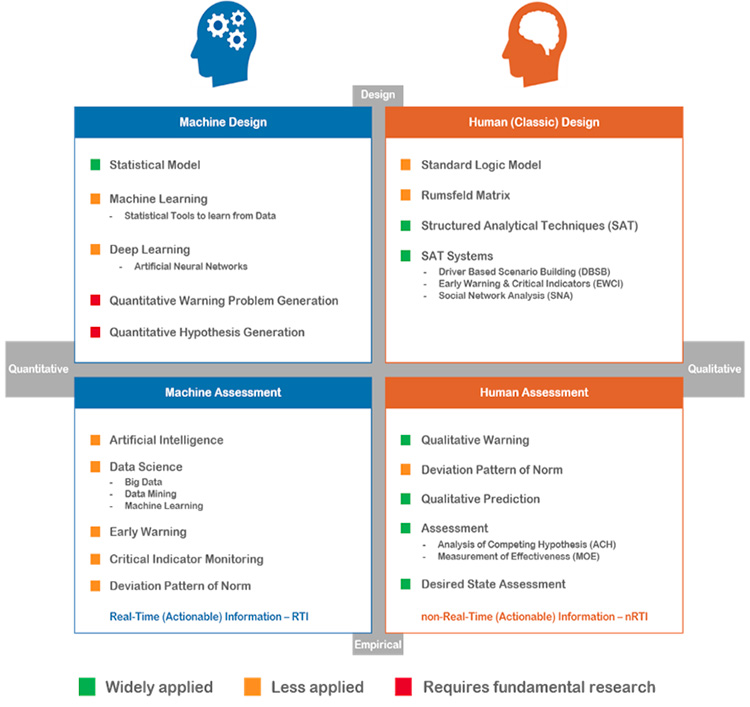
Figure 1: The Analytic Black Holes Model.
Human Design
The design of an analysis is now almost entirely in the human domain. Although not all elements are used in actual practice, the concepts of the human designing encompass almost all analytic levels, and almost all disciplines. It is pretty well developed, although some analytic black holes remain.
In its essence, three layers can be distinguished in analysis by humans, as opposed to Machine Analysis. The current three layers are:
- Rumsfeld Matrix (Composing a β-research design)
- Structured Analytic Techniques (SAT’s)
- Research processes, many build on SAT’s
Rumsfeld matrix
The Rumsfeld is a tool for a β-research design – in order not to miss a threat. On the x-axis, it is put whether the way of how to retrieve data is known or not [retrieval]. On the y-axis, it is put whether the data themselves are known or not [data]. This leads to four combinations of retrieval [known/unknown] and data [known/unknown]. Arranged in a matrix, it results in the next composing elements:

Figure 2: The Rumsfeld Matrix in the context of Airport Security.
For every subquestion of a problem, puzzle, or mystery, a matrix is designed. For more information, see. Although it has been exercised at Dutch universities for many years with this tool, it is hardly used in practice.
Structured Analytic Techniques (SAT’s)
At a third level, Structured Analytic Techniques (SAT’s) are implemented. Especially since the beginning of this millennium, structured analytical techniques are massively used within the Dutch security community. Handbooks are used as Heuer & Pherson.
SAT’s based research processes
Finally, research processes are arranged based on SAT’s. For different field, whole sets of interrelated SAT’s are developed as for, for example Early Warning & Critical Indicator (EWCI; a NATO version is known as NATO Intelligence Warning System, NIWS) or Driver-Based Scenario Building (DBSB; also known as the Shell-method). In both cases, these research processes are aimed at dealing with data that is characteristic for analysis by humans: this is to limit the number of crucial data by selecting a specific group of data as being the core of that type of analysis, that focusses on causal relationships in the first place. In EWCI the focus is on Critical Indicators. In DBSB, the focus is on drivers. Still, a lot of data is processed, but the crucial data in the whole process is limited to the mentioned sets.
There are also analyses in which the design and assessment is done by humans, but the calculation and processing is carried out by machines. It is a start of a merger of Human and Machine Analysis, but still the lead is here with humans. An example of such analysis is Social Network Analysis. It is aimed at gaining insight or to solve a problem.
Security analysis are mainly warning and problem oriented. Often warning is seen as its core. The complementary approach is that of getting towards the desired state. An example of that is the so-called Research Guided Action Planning (see later in this article). This last approach is somewhat underdeveloped, and hardly applied to protect the critical infrastructure.
Human Assessment
Also in the assessments, there is a bias towards to assessments by humans, contrary to the Machine Assessments. The Human Assessments is composed of elements as Qualitative Early Warning Analysis, deviation of the Pattern of Norm, Qualitative Prediction, and testing and measuring of Analysis of Competing Hypotheses and the Measurement of Effectiveness (MoE). Although during some steps of the analytic process computers are used, the actual assessments are carried out by humans.
Machine Design
There is hardly any machine designing. Use is made of to build statistical modelling. But although designing artificial neural network is possible, there is hardly made use of it. Some aspects of machine designing are still to be developed, as Automated Quantitative Warning Problem Generation, and Automated Quantitative Hypotheses Generation.
Machine Assessment
The quadrant of Machine Assessment is underdeveloped. There are hardly assessments by Artificial Intelligence. There is use of datamining, big data and machine learning, but the potential is not used fully. Also on other aspects, as the generation of Machine Assessments is hardly developed. The automated warning if a Critical Indicator surpasses its threshold is used, but could be applied more widely and more automated within the critical infrastructure. Automated warning, deviation of the pattern of norm, and automated prediction is either underdeveloped or hardly present.
Analytic Black Holes
In the quick scan of what we do and don’t do with data, it was not strived for completion. The aim was to get an overall impression if the possibilities to deal with data were use or not. To summarize the four quadrants, there are some major Analytic Black Holes, especially in the realm of Machine Designing and Machine Assessment. These gaps – analytic black holes – are indicated in orange and red. Although there is an immense amount of data available, the main emphasis of the analytical process is on human activity. Humans are not only slower than machines; they also process less data than machines. Based on the perspective of data available, you would have expected the opposite. You would expect automation and mass production, instead of the analyst working slowly on its unique case.
It also results in a difference between real time intelligence (machine) and near time intelligence (human). As a result of that difference in time span, human analysis is slower to respond to a threat. In Machine Analysis, the change is higher that a threat cannot come to fruition.
How could we fill the gap?
In this essay, it is not aimed at to resolve the Analytic Black Holes issue. Yet, for the main problem, that of missing massive numbers of data, some suggestions will be made. It will be argued how Data Science Cells could cope with some of the needs mentioned. In Data Science Cells, enormous amount of data can be processed, that can never be processed in that quantity by humans. Machine Analysis plays a central role here.
In the next part, some thoughts are developed of how to develop such Data Science Cells. It is proposed to compose it of eight elements. Those eight composing parts will be explained.
Data Science Cell
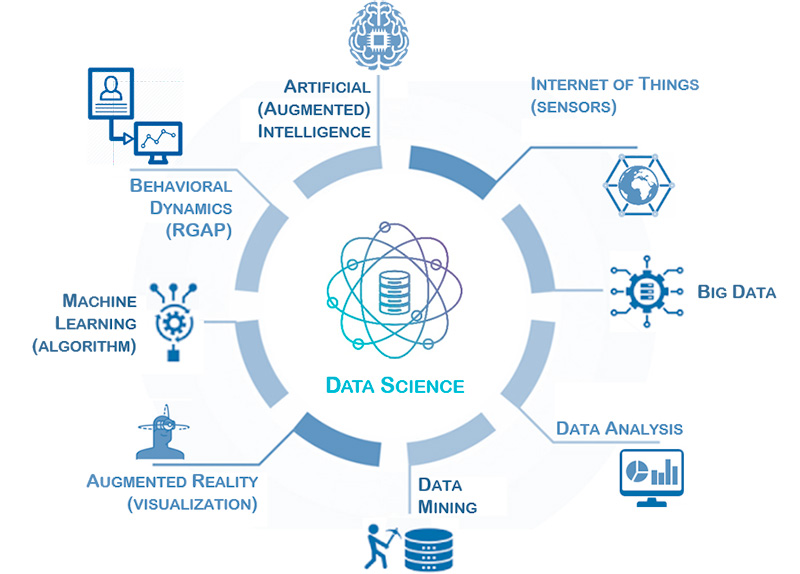
In this section we will provide a detailed description of the proposed Data Science Cell configuration (see figure 4). The proposed configuration consists of eight elements that can be viewed as steps for data enrichment, which add value to the data through Analytics. The proposed Data Science model facilitates Descriptive, Diagnostic, Predictive, Prescriptive Analytics , and Artificial Intelligence. Artificial Intelligence serves as an enhancement of human reasoning. This works as follows. Firstly, descriptive and diagnostic analytics offers merely a reactive approach; predictive and prescriptive analytics, on the other hand, enables proactive interventions. Secondly, humans cannot deal with as much data as machines. Thirdly, the more complex the research is on the scale from descriptive (most simple) to prescriptive (most complex), the more data is needed to have an adequate as possible outcome. As Machine Analysis can do this with a far greater number of data and in a continuous feedback and learning loop, the (implicit) message of this model is that predictive and prescriptive analytics essentially need to be Machine-Centered for an optimal outcome. It may not apply to all types of analyses, but the model points at some underdeveloped aspects concerning the use of machines in many nowadays analyses.
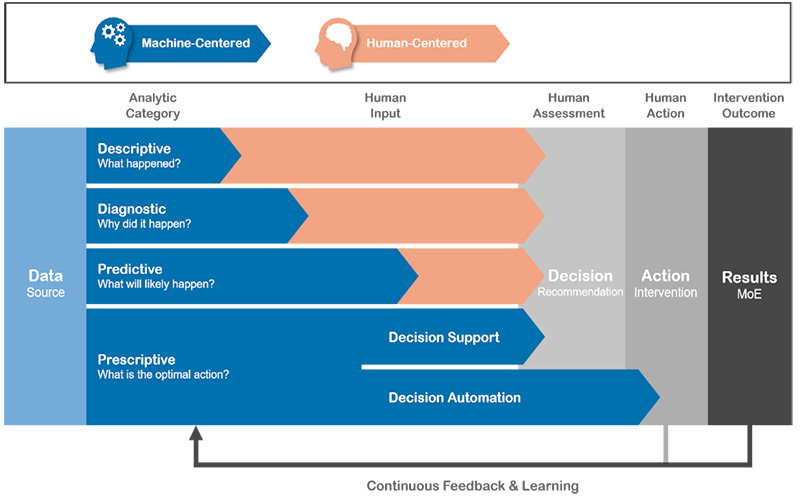
Figure 3: Analytics from Description to Prescription.
The large amount of data that is collected, is stored in the Big Data platform. This Big Data platform facilitates the storage of vast amount of structured and unstructured data. The Data Analysis step in the proposed Data Science model involves developing models, explanations, testing and proposing hypotheses. Data Mining step discovers previously unseen patterns and relationships from the large datasets. These last two steps represent the descriptive and diagnostic stage of the Gartner Analytics Continuum. Step five facilitates data visualization. The analyzed data can be visualized as Dashboards or even superimposed as digital information on the physical world (Augmented Reality).
Predictive analytics is performed by Machine Learning step. Machine Learning is comprised of statistical tools that learn from data and subsequently classify or make predictions on a new sets of data. Step seven represents the prescriptive analytics. In the proposed model, prescriptive analytics is performed by Research Guided Action Planning (Behavioral Dynamics), where effective and measurable influence strategies are designed to achieve a desired outcome. The Artificial Intelligence (step eight) in the Data Science model can learn from the data, the proposed interventions, the decisions making, and – through the feedback loop – the effectiveness of executed actions. In the long-term, this technological enabler has potential of enhancing human reasoning (Augmented Intelligence), supporting decision-making or simulating possible outcome. In addition, this proposed configuration of a Data Science model enables the construction of institutional memory, and knowledge.
Figure 4: A possible configuration of a Data Science Cell to protect the Critical Infrastructure by enabling Analytics from Description to Prescription and Artificial Intelligence.
Internet of Things

According to the International Telecommunication Union (ITU), Internet of Things (IoT) is defined as a global infrastructure for the information society, enabling advanced services by interconnecting (physical and virtual) things based on existing and evolving interoperable information and communication technologies. The IoT has its origins in military research. In the late 1970s and into the mid-1980s, United States Defense Advanced Research Projects Agency (DARPA) had a research program working on distributed sensor networks – a technological precursor to the internet of things.
The explosive growth of technologies in the commercial sector that exploits the convergence of cloud computing, ubiquitous mobile communications, networks of data-gathering sensors, and artificial intelligence presents an imposing challenge for the critical infrastructure. These Internet of Things (IoT) technologies will provide adversaries ever increasing capabilities to attack the critical infrastructure that must be countered.
Big Data

The term Big Data refers to all the data that is generated across the globe at an unprecedented rate and exceeds the processing capacity of conventional database systems. The data is too big, moves too fast, or doesn’t fit the structure of the organization’s database architectures. This data could be either structured, semi-structured or unstructured. Structured means that the data is neatly tagged and categorized for a certain purpose. This data that has been organized into a formatted repository, typically a database, has the advantage of being easily entered, stored, queried and analyzed.
Unstructured data on the other hand is data that is recorded without much intent or purpose. Unstructured data continues to grow in influence, as organizations try to leverage new and emerging data sources. Since the diversity among unstructured data sources is so prevalent, organizations have much more difficulty managing it than they do with structured data. As a result, organizations are challenged in ways they were not before and require to become creative and innovative in collecting relevant data for analytics.
Semi-structured data is data that has not been organized into a specialized repository, such as a database, but that nevertheless has associated information, such as metadata, that makes it more amenable to processing than raw data. An example of semi-structured data is a Word document where metadata tags are added in the form of keywords and other metadata that represent the document content. This will make it easier for the document to be found when searched for those terms – the data is now semi-structured. According to Gartner unstructured data makes up 80% of enterprise data and is growing expeditiously.
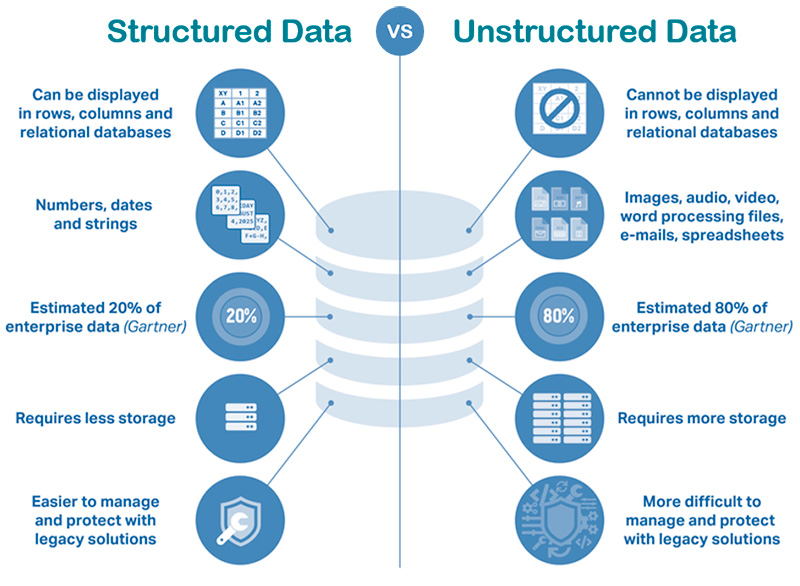
Figure 5: Structured versus Unstructured Data.
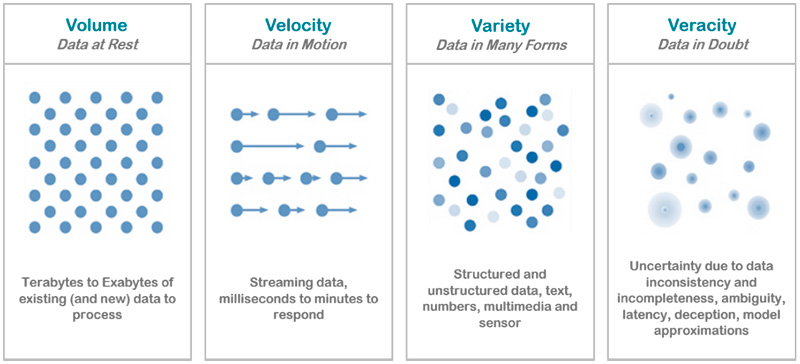
Big Data is differentiated from traditional technologies in four ways: Volume, Velocity, Variety and Veracity.
- Volume: refers to the vast amount of data that is being created. Organizations collect data from a variety of sources, including social media and information from sensor or machine-to-machine data. Here lies the essential value of Big Data sets – with so much data available there is huge potential for analysis and pattern finding to an extent unavailable to human analysis or traditional computing techniques. To this end, Big Data has underpinned the growth of cloud computing, distributed computing and edge computing platforms, as well as driving the emerging fields of machine learning and artificial intelligence.
- Velocity: refers to the rate at which new data is being generated. The growth of global networks and the spread of the Internet of Things in particular means that data is being generated and transmitted at an unparalleled speed and must be dealt with in a proper and timely manner. Much of this data needs to be analyzed in real-time, so it is critical that Big Data systems are able to cope with the speed and volume of data generated, while maintaining the integrity of real-time and historical data.
- Variety: refers to the different types and formats of data. The data that is generated is completely heterogeneous in the sense that it could be in various formats, from structured, numeric data in traditional databases to unstructured text documents, email, video, audio, sensor data, data from wearable devices, satellite images, and Internet of Things technologies. Merging and managing such different forms is one of the aspects of Big Data.
• Veracity: refers to the accuracy, quality and validity of Big Data. Such large amount of data could contain noise and abnormalities. If the data is not accurate or reliable, then the expected benefits of the Big Data initiative will be lost. This is especially true when dealing with real-time data. Ensuring the veracity of data is of utmost importance before implementing Big Data.
Figure 6: Characteristics of Big Data, its Volume, Velocity, Variety and Veracity.
The storage, processing and analytics of Big Data can either be performed in real-time (no latency) or by batch (latency) processing. The open source framework commonly used for Big Data is the “Lambda Architecture”, which consists of a Speed Layer (e.g. Storm) for real-time processing and a Batch Layer (e.g. Hadoop or Spark) for batch processing.
Data Analysis (extract, transform and load)

Data Analysis is a superset of Data Mining that involves extracting, inspecting, cleaning, transforming, modeling and visualization of data to improves the quality of data, uncover meaningful and useful information that can support in deriving conclusions, making decisions, and consequently improve the quality of data mining results. Data Analysis is responsible for developing models, explanations, testing and proposing hypotheses using analytical methods. The output of Data Analysis process can be a verified hypothesis, visualization of data, or insight on the data.
Data Mining (recognizing meaningful patterns)

Data mining pulls together data based on the information it mines from Big Data and uses statistics as well as other programming methods to discover previously unseen patterns and relationships from large datasets, so that a phenomenon can be explained. It focuses on uncovering relationships between two or more variables in a dataset, discovering hidden patterns or unknown knowledge. Which than can be used for decision making or serves as a foundation for Machine Learning and Artificial Intelligence.
Key differences between Data Mining and Data Analysis
Data mining is usually a part of data analysis where the aim or intention remains discovering or identifying only the pattern from a dataset. Data Analysis, on the other hand, comes as a complete package for making sense from the data which may or may not involve data mining. To establish their unique identities, we emphasize the major difference between Data Mining and Data Analysis:
- Data Mining is one of the activities in Data Analysis. Data Analysis is a complete set of activities which takes care of the collection, preparation, and modeling of data for extracting meaningful insights or knowledge.
- Data Mining identifies and discovers a hidden pattern in large datasets. Data Analysis provides insights or tests hypothesis or model from a dataset.
- Data Mining studies are mostly on structured data. Data Analysis can be performed on both structured, semi-structured or unstructured data.
- The goal of Data Mining is to render data more usable, while the Data Analysis supports in proving a hypothesis or making decisions.
- Data Mining doesn’t need any preconceived hypothesis to identify the pattern or trend in the data. On the other hand, Data Analysis tests a given hypothesis.
- While Data mining is based on mathematical and scientific methods to identify patterns or trends, Data Analysis uses intelligence and analytics models.
- Data mining generally doesn’t involve visualization tool, Data Analysis is accompanied by visualization of results.
Data Mining and Data Analysis require different skillset and expertise. Data Mining expertise involves the intersection of Machine Learning, statistics, and databases. Data Analysis area of expertise requires the knowledge of computer science, statistics, mathematics, subject knowledge, Artificial Intelligence and Machine Learning.
Augmented Reality (visualization)

Augmented reality is superimposing digital data on the physical world: when technology is used to place digital elements in real-world spaces. By contrast, virtual reality is when the user sees only digital imagery. Analyzed data can be superimposed as digital tactical information over the user’s field of view. Using augmented reality system, you can visualize the location of other objects/actors even when these are not visible to you. In addition, the system can be used to communicate information including imagery, navigation routes, and alerts.
Machine Learning (predicting outcome from known patterns)

Machine Learning uses datasets formed from mined data and automatically learns the parameters of models from that data, by applying self-learning algorithms. Generally speaking, the larger the datasets, the better the accuracy and performance. Learning can be by batch wherein the models are trained once, or continuous wherein the models evolve as more data is ingested with time. In the latter mode, based on the new data and feedback received, the machine constantly improves itself and the results increase in accuracy with time. In short, Machine Learning is about learning a model to classify new objects. Examples of Machine Learning algorithms are: Find-S, Decision trees, Random forests (composed of many Decision Trees), and Artificial Neural Networks. These algorithms can be classified in Supervised, Unsupervised and Reinforcement Machine Learning algorithms.
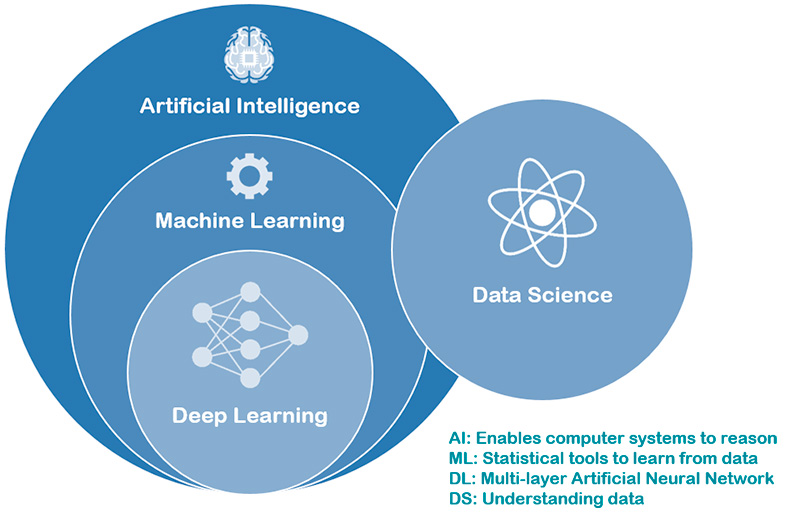
Deep Learning is a subset of Machine Learning which uses multi—layer Artificial Neural Network to perform pattern recognition and forecasting.
Behavioral Dynamics (research guided action planning – RGAP)

Research Guided Action Planning (RGAP) is based on the Behavior Dynamic Methodology (BDM) and is a scientific approach for conducting effective and measurable Influence Strategies and Strategic Communication. It is applicable to all scenarios and spheres of conduct where the shaping and management of behavior, perception and attitudes is critical for success, such as conflict, public diplomacy, violence reduction, peace maintenance, and social marketing. This wide variety of applications implies it is relevant to protect the critical infrastructure too. In a context in which an opponent not only digitally attacks the critical infrastructure, but also acts subversive by influencing the narratives in a negative way, RGAP seems an approach that we hardly cannot afford to be without with. BDM is founded on three categories of Research Parameters (Descriptive, Prognostic and Transformative) that have been the subject of empirical and theoretical investigation over many years and have been established as critical factors in the influence and persuasion of groups. Through Research Guided Action Planning (Behavioral Dynamics), effective and measurable influence strategies are designed to achieve a desired outcome. Protecting the critical infrastructure is then not only limited to defensive measures, but also supported by steering towards the desired strategy. Without RGAP, it would leave the shaping of the society to the subversive strategies of an opponent.
Artificial and Augmented Intelligence (behaving and reasoning)

Artificial Intelligence uses models built by Machine Learning and other ways to reason about the world and give rise to intelligent behavior, providing the system with the ability to reason. In its essence, a machine is trying to mimic one aspect of human intelligence. Intelligent systems form a hypothesis from raw, disparate data to develop new information which is not a direct result of the models of data it was provided, or its current knowledge. Through reasoning, artificial intelligence can create associations between entities or events without ever having seen such maps or patterns before.
Deep Learning is a subset of Machine Learning, and Machine Learning is a subset of Artificial Intelligence, which by itself is an umbrella term for any machine (computer program) that has the capability to imitate intelligent human behavior. In other words, it is a computer system able to perform tasks that normally require human intelligence, such as visual perception, speech recognition, decision-making, and translation between languages.
Artificial Intelligence platforms provide users a tool kit to build intelligence applications. These platforms combine intelligent, decision-making algorithms with data, which enables developers to create a corporate solution.
Augmented Intelligence, or Intelligence Augmentation (IA), is a subset of Artificial Intelligence technology that emulates and extends human cognitive abilities in software, such as memory and sequencing, perception, anticipation, problem solving, and decision making. Augmented Intelligence emulates and extends human cognitive function through the pairing of humans and machines. It enhances human intelligence rather than replacing it. Augmented Intelligence systems use artificial intelligence techniques such as machine learning, deep learning, natural language processing, spatial navigation, machine vision, logical reasoning, and pattern recognition to complement humans in finding hidden meaning within all data and transform user engagement by providing the right advice, at the right time, with the right evidence across any contact point – and therefore ultimately make more informed decisions with their data.
An impression was given of a Data Science Cell, as an example of how to deal with some Analytic Black Holes. It will not be the only answer, and also not the only variation of Data Science Cell. That will vary from organization to organization.
Figure 7: Artificial Intelligence Spectrum: Human versus Machine – Human and Machine.
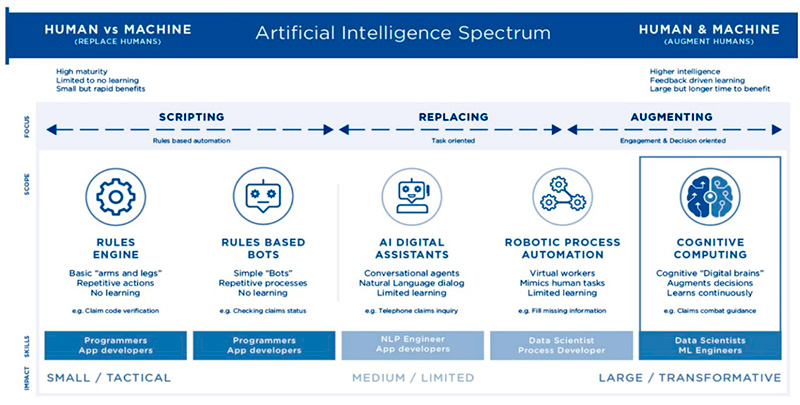
Figure 8: Visualization of Artificial Intelligence, Machine Learning, Deep Learning and Data Science.
Having a Data Science Cell in place, does not mean that it will replace the analysis by humans. Both can be developed further, but the biggest analytic black holes – in terms of data unused – are in the realm of Machine Analysis. Eventually, we will develop to a more mature way of analyzing, at least from the point of unused data. In that new situation, design and assessment can be carried out by machines or humans, depending on the task to be fulfilled. In the most optimal way, it will be a merger of human and machine, and intelligence analysis will be transformed by a second analytical revolution. As put, the first was formed by the massive introduction of structured analytical techniques for analysis by humans. Now, we are moving towards a second revolution – that of a merger between human and machine analysis. This second revolution can be characterized as the Augmented Intelligence revolution. Augmented Intelligence emulates and extends human cognitive function through the pairing of humans and machines. It enhances human intelligence rather than replacing it.
To what extra capabilities for our critical infrastructure could this new approach lead to?
We could deal earlier, better and more directed with hybrid threats than we do nowadays. The main point is that we can reduce the number of shaping activities that we now miss. This is the so-called Grey Zone. The Grey Zone can be defined as those covert or illegal activities of nontraditional statecraft that are below the threshold of armed organized violence; including disruption of order, political subversion of government or non-governmental organizations, psychological operations, abuse of legal processes, and financial corruption as part of an integrated design to achieve strategic advantage.
Attacking the critical infrastructure is exactly at the heart of such a disruption of order that can have severe consequences. Through Augmented Intelligence, the grey zone of undetected shaping activities will be reduced in two ways. Firstly, the detection threshold can be lowered, so fewer shaping activities remain undisclosed. Secondly, the threshold to act will be reduced in terms of time, so we can act sooner than before. It will result in a boost to cope with the hybrid threat. As the critical infrastructure is, by its definition, critical for our society, we need to use the available data more to its full potential.
The need of dealing with the Grey Zone is not only relevant because the shaping activities, but also because we live in a changing security environment. Security will move more and more to the digital domain. The population will increasingly become more an actor, both as a perpetrator and as sensor. The crowd may finally outnumber and ‘outsensor’ the classic gatekeepers of security. In an information society, the emphasis will shift from denial to deception, as there is less to hide. And human analysis is not fast enough. All these elements further underpin the need of moving towards Augmented Intelligence.
Conclusion
This essay started with three basic questions of data that is not used:
1. What do we do and what do we not do with data, and how much data do we leave unused?
2. How could we fill the gap?
3. And to what extra capabilities could this new approach lead to?
The number of data is exploding, especially unstructured data. But they remain largely unused in analyses because humans cannot process so much data. There are some serious gaps in our analytic potential – the Analytic Black Holes. By reflecting on the phases of the designing and the assessment, it was argued that a more fundamental change is needed in our current way of working. Otherwise, too many data will be left unused in the process of protecting the critical infrastructure.
The analytic black holes are mainly in the field of Machine Analysis. The cyber threats to the critical infrastructure, and the huge consequences of successful attacks, demand a new approach towards analysis. This gap needs to be filled, for example, by data science cells that can process data automatically.
But also for human analysis, some methods have the potential of using data that otherwise remain unused – such as the Rumsfeld Matrix, or RGAP. To apply these methods will lead to the use of more data, and therfore to a better coverage of the issue at hand – being the protection of the critical infrastructure.
The first analytic revolution to protect the critical infrastructure was the massive introduction and use of Structured Analytic Techniques, both qualitative and quantitative. A second analytic revolution, that of Augmented Intelligence, seems to be needed as a result of the change in data flows and the need for new products.
If the analytic black holes are dealt with, a new way of working will be reached. It will be an approach in which humans and machine are interacting. Sometimes an analysis will be completely carried out by humans or by machines – from the design to the assessment – or a mix of both. This way, a new approach will be reached – that of Augmented Intelligence – in which humans and machines are paired in their analytic effort.
Human Analysis is likely to develop more towards an analysis in which a limited number of data are taken into account, but those data will have a high causal significance. Machine Analysis, on the other hand, will process huge amount of data and focus on correlations in the first place. Augmented Intelligence, will be a merger of both, that can manifest itself in different combinations of both. And in which the human and machine analysis can validate each other. This paradigm change towards Augmented Intelligence will deal better with data that now remains unused. It has the potential to fill the gap of the identified analytic black holes. Dealing with the analytic black holes will enhance the security and make us more effective in protecting the critical infrastructure.
Citate:
APA 6th Edition
de Valk, G. (2022). Analytic Black Holes: a data-oriented perspective. National security and the future, 23 (1), 21-48. https://doi.org/10.37458/nstf.23.1.1
MLA 8th Edition
de Valk, Giliam. "Analytic Black Holes: a data-oriented perspective." National security and the future, vol. 23, br. 1, 2022, str. 21-48. https://doi.org/10.37458/nstf.23.1.1 Citirano DD.MM.YYYY.
Chicago 17th Edition
de Valk, Giliam. "Analytic Black Holes: a data-oriented perspective." National security and the future 23, br. 1 (2022): 21-48. https://doi.org/10.37458/nstf.23.1.1
Harvard
de Valk, G. (2022). 'Analytic Black Holes: a data-oriented perspective', National security and the future, 23(1), str. 21-48. https://doi.org/10.37458/nstf.23.1.1
Vancouver
de Valk G. Analytic Black Holes: a data-oriented perspective. National security and the future [Internet]. 2022 [pristupljeno DD.MM.YYYY.];23(1):21-48. https://doi.org/10.37458/nstf.23.1.1
IEEE
G. de Valk, "Analytic Black Holes: a data-oriented perspective", National security and the future, vol.23, br. 1, str. 21-48, 2022. [Online]. https://doi.org/10.37458/nstf.23.1.1
Literature
1. John Arguilla, John (2018), Perils of the Gray Zone, Paradigms Lost, Paradoxes Regained, Vol. 7 no. 2, PRISM, 124.
2. Chiang, Catherine (2018), In the Machine Learning Era, Unstructured Data Management is More Important Than Ever. Igneous.
3. DARPA (United States Defense Advanced Research Projects Agency [DARPA]) (1986), Distributed Sensor Network (DSN). ESD Lincoln Laboratory Project Office.
4. https://www.educba.com/data-mining-vs-data-analysis/ (consulted: August 2021)
5. Pedamkar, Priya, Data Mining vs Data Analysis. https://www.educba.com/data-mining-vs-data-analysis/ (consulted August 2021)
6. Freedberg, Sydney J. Jr. (2018), HUD 3.0: Army To Test Augmented Reality For Infantry In 18 Months. Breaking Defense.
7. https://www.g2crowd.com/categories/artificial-intelligence (consulted August 2021).
8. https://www.gartner.com/en/information-technology/glossary/big-data (consulted August 2021).
9. Gartner (2013), The Analytics Continuum. (https://www.gartner.com)
10. Gartner (2017), Planning Guide for Data and Analytics, Gartner Technical Professional Advice, October 2016. (https://www.gartner.com)
11. Heuer, R., Pherson, R.H. (2014), Structured Analytic Techniques for Intelligence Analysis. CQ Press.
12. International Data Corporation (IDC) (2018), The Digitiza-tion of the World. From Edge to Core. Data Age 2025.
13. International Telecommunication Union (ITU) (2012), Next Generation Networks – Frameworks and functional architecture models. Overview of the Internet of things. Telecommunication Standardization Sector of ITU.
14. Klonowska, Klaudia & Frank Bekkers (2021), Behavior-Oriented Operations in the Military Context, Enhancing Capabilities to Understand and Anticipate Human Beha-vior. The Hague Centre for Strategic Studies.
15. Laney D. (2001), 3D data management: Controlling data volume, velocity and variety. In: Meta Group. (http://blogs.gartner.com/doug-laney/files/2012/01/ad949-3D-Data-Management-Controlling-Data-Volume-Velocity-and-Variety.pdf)
16. Madrigal, Alexis C. (2014), How DARPA’s Augmented Reality Software Works. Why is the military succeeding where Google Glass failed?. The Atlantic Technology.
17. McCarthy, John (2018), Artificial Intelligence, Symbolic AI and GOFAI. Artificial Intelligence Wiki.
18. Patidar, Shailna (2018), Machine Learning vs. Deep Learning. AI Zone.
19. Sabhikhi, Akshay (2017), Augmented Intelligence. Executive Guide to AI. Cognitive Scale.
20. Valk, Giliam de (2005), Dutch intelligence - towards a qualitative framework for analysis: with case studies on the Shipping Research Bureau and the National Security Service (BVD). Boom Juridisch.
21. Valk, Giliam de (2018), Vital Infrastructure and the unknown: a methodological quest, In: National Security and the Future, Volume 19, No.1-2.